Question
Physics 211, Astronomy 211 - A car is moving with constant speed along a straight line. (This is the same as saying the car is moving with constant velocity.) Let the straight line be called the x-axis. Suppose that at t = -4 s the car is at x = 100 m and at t = 2 s the car is at x= -20 m. Plot an x vs. t graph of the car's motion, and derive an equation relating x vs. t for the car. (Analytical geometry.)
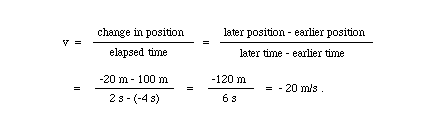
Hint: Velocity is defined as (change in position)/(change in time). Here, the velocity is given to be constant.
Answer
Let us do the derivation first. Let us denote the car's velocity by v. From the information given, we can determine v as follows:
If t is an arbitrary instant of time and x the car's position at time t, then one can express the velocity v also as follows:
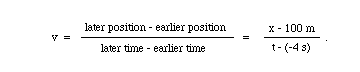
Equating v to -20 m/s in the last equation, gives us an equation relating x and t: -20 = (x - 100)/(t + 4). We need to isolate x. This can be done by multiplying both sides of the equation by the denominator t + 4. The result is
Adding 100 to both sides of the equation leads to
This is the final result. No units are indicated here. It is understood that all values of x are in meters and all values of t are in seconds.
It is useful to verify this result by substituting the two given points into this equation. E.g., if we set t = 2 s, the right-hand side of the last equation reduces to (-20 times 2) plus 20, which equals -20 m. This is the correct value. You may want to check that one also gets the correct value when substituting t = -4 s.
The graph of x vs. t is shown below. One can obtain this graph in several ways. The easiest method is probably to plot the two given points and then to draw the straight line connecting the points. This is what was done here. The x vx. t graph must be a straight line because the velocity is constant. The velocity is equal to the slope of the graph because the change in position and the change in time are the "rise" and the "run" of the graph, respectively. You will remember that the slope is equal to the ratio rise over run. The two given points are indicated by black dots.
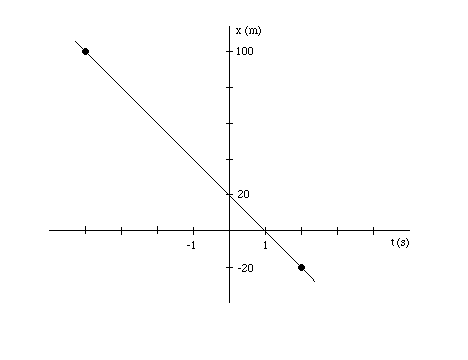
Notice that the slope of the graph is indeed equal to -20 m/s because x decreases by 20 m for every 1-second increase of t.