Question (a). The graph of the equation x = at + b is a straight line (as long as the t and x axes use linear scales, i.e., scales on which equal increments of t and x are represented by equal distances). Why is this so? What kind of an equation relating x to t would result in a nonlinear graph?
Answer
The graph is a straight line because the variables x and t occur in the first power. If x and t occur in the first power, the average slope of the graph has the same value for all t-intervals. This is only possible if the graph is a straight line. What is meant by average slope and how can one show that it is constant?
The average slope of a graph of x vs. t over a given interval is defined as the ratio of (change in x)/(change in t). Let t1 and t2 be two t-values and x1 and x2 the corresponding x-values. The given equation relates these t and x values as follows:
Subtracting the second equation from the first one gives
whence the average slope over the interval from t1 to t2 is equal to
To get a graph that is not a straight line, one only has to choose the power of x or t or both to be different from one. For example, the graph of x = at2+b is not a straight line because t is raised to the second power. It is a parabola.
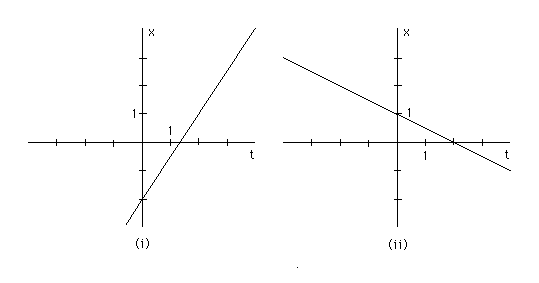
Question (b). Which quantities on the graph in part (a) represent the quantities a and b? Illustrate this by drawing the graphs corresponding to (i) a = 1.5 and b = -2 and (ii) a = -0.5 and b = 1. Put t on the horizontal axis and x on the vertical axis.
Answer. The two graphs are shown below.

As the calculation in part (a) shows, the parameter "a" is equal to the slope of the graph. Indeed, the slope of graph (i) is equal to 1.5. As t increases from 0 to 2, x increases from -2 to +1. Thus, as t changes by 2, x changes by 3, so that slope = (change in x)/(change in t) = 3/2 = 1.5. Similarly, the slope of graph (ii) is equal to -0.5 because as t increases from 0 to 2, x changes from 1 to 0. Thus, for a change in t by 2 we have a change in x by -1, so that the slope is equal to -1/2 = -0.5.
How do graphs (i) and (ii) show the values of b in the two cases? Substituting t = 0 into the equation x = at + b, gives x = b. Thus, b is equal to the value of x corresponding to t = 0. In other words, b is equal to the intercept of the graph with the x-axis (since t = 0 for all points along the x-axis.) Indeed graphs (i) and (ii) intercept the x-axis at x = -2 and x = 1, respectively.
Question (c). For the two graphs in part (b), what are the values of the intercepts with the t-axis? How would you calculate these intercepts? Do the calculated values agree with those shown by the graphs? What is the physical interpretation of these intercepts?
Answer
All points on the t-axis have x = 0. Thus, we must set x = 0 in the equation x=at+b to find the intercept with the t-axis. Thus,
Substituting the given values for a and b, we obtain
These values agree with the t-axis intercepts on the graphs.
These t-axis intercepts show the times at which the object passes the point x = 0.
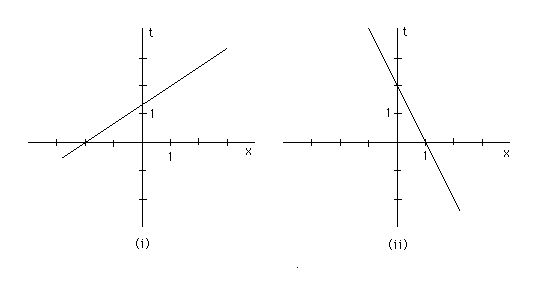
Question (d). Now graph the two cases (i) and (ii) from part (b) so that x is on the horizontal axis and t is on the vertical axis. What are the physical interpretations of the intercepts with the two axes now? Do the values of these intercepts as shown by the graphs agree with the values that can be calculated from the given equation?
Answer. The two graphs are shown below.

The physical interpretations of the intercepts with the x and t axes are the same as before and the values of these intercepts are the same as before, except that the x-intercept is now on the horizontal and the t-intercept now on the vertical axis.
Question (e). Determine the slopes of the graphs of x vs. t and t vx. x obtained in parts (b) and (d), respectively. How are these slopes related? Can you explain why the slopes are related the way they are?
Answer
Let us do this for graph (i) only. To repeat the same calculations for graph (ii) is left as an exercise for you, the reader.
The slope of the x vs. t graph in part (b) is equal to a = 1.5 = 3/2. The slope of the t vs. x graph in part (d) is equal to 2/3 = 0.67. (As x increases from -2 to 0, t increases from 0 to 4/3; thus the slope is equal to (4/3)/2 = 2/3.) The product of the slopes in parts (b) and (d) is equal to (3/2)x(2/3)=1.
When plotting a straight-line graph of x vs. t and the corresponding straight-line graph of t vs. x, the product of the two slopes is always equal to 1. Or, equivalently, the slope of the graph in part (d) is the reciprocal of that of the graph in part (b). This can be understood as follows. When plotting x vs. t, the slope is equal to (change in x)/(change in t). This is obviously the reciprocal of (change in t)/(change in x), which is the slope of the t vs. x graph.
As an exercise, you may want to solve the equation x=at+b for t and show that the result is t=(1/a)x-b/a. This too shows that the slope of the t vs. x graph is equal to 1/a, i.e., equal to the reciprocal of the slope of the x vs. t graph.