Question
Physics 211 - In the July 18 and 25, 1997 questions you were asked to start from a displacement vs. time graph and find the corresponding velocity vs. time graph. Today you will be asked to do the opposite. (Graphs.)
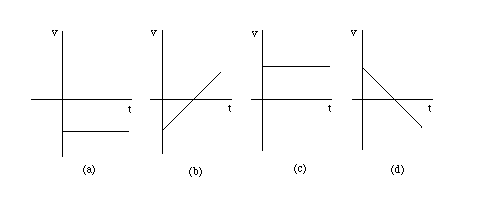
Consider once more the four velocity vs. time graphs shown below.

For each of the four cases (a) to (d), draw (i) the corresponding displacement vs. time graph that has Dx = 0 at t = 0, (ii) the position vs. time graph that has x = 10 m at t = 0, and (iii) the position vs. time graph that has x = -10 m at t = 0.
Hint: Review the answer to the July 25, 1997 question.
Answer
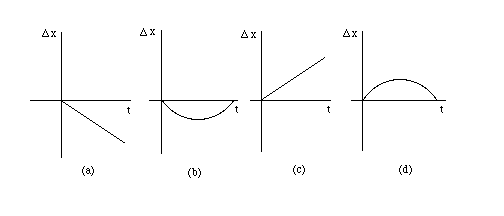
(i) The following diagram shows Dx vs. t corresponding to the cases (a) to (d). Note that Dx starts with 0 at t = 0 in all four cases, as stipulated above. The slope of Dx vs. t at any given time t is equal to the value of v at that time that is shown in the corresponding graph above.

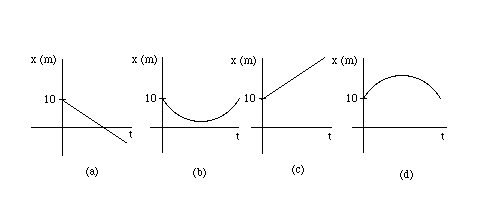
(ii) The following diagram shows x vs. t corresponding to the cases (a) to (d). Note that x = 10 m at t = 0 in all four cases, as stipulated above. The slope of x vs. t at any given time t is equal to the value of v at that time that is shown in the corresponding graph above. The graphs of x vs. t are identical in shape to those of Dx vs. t above, but are shifted upward by 10 m.

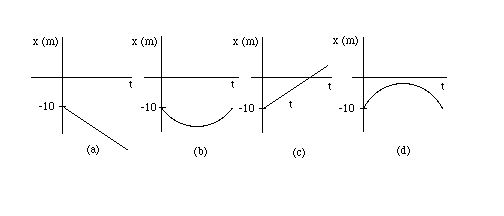
(iii) The following diagram shows x vs. t corresponding to the cases (a) to (d). Note that x = -10 m at t = 0 in all four cases, as stipulated above. The slope of x vs. t at any given time t is equal to the value of v at that time that is shown in the corresponding graph above. The graphs of x vs. t are identical in shape to those of Dx vs. t above, but are shifted downward by 10 m.
