Question
Physics 211 - The July 18, 1997 question asked you to consider the following four displacement vs. time graphs.

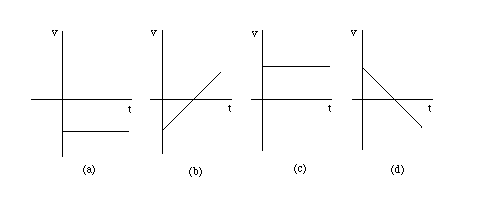
The corresponding velocity vs. time graphs are shown below.

Explain why these velocity vs. time graphs are consistent with the displacement vs. time graphs.
Hint: For a definition of velocity, see the July 18, 1997 question.
Answer
Let us try to understand graph (a). The velocity at a given instant is equal to the slope of the position vs. time graph at that instant. Here we are given the displacement vs. time graph, not the position vs. time graph. So how is that related to the position vs. time graph?
The displacement Dx = x - xr at time t differs from the position x at time t only by the position xr at some reference time tr. The reference position xr is the position from which we want to measure the displacement. When the object is at x = xr, e.g., at t = tr, the object's displacement is Dx = x - xr = xr - xr = 0. In each of the following diagrams (a) to (d), one time tr has been indicated at which the displacement is zero.

Suppose the position x = xr is equal to 10 m. Then the displacement at a general time t is equal to Dx = x - 10 so that x = Dx + 10. The followig four diagrams show x vs. t corresponding to the graphs of Dx vs. t above assuming xr = 10 m in all four cases.

Notice that the graphs of x vs. t have the same shapes as those of Dx vs. t, but that they are translated vertically upward relative to the Dx vs. t graphs by 10 m. Thus, at a given instant t, the two kinds of graph have the same slope.
Thus, the velocity v at a given instant is equal to the slope of the Dx vs. t graph at that instant. In the case of graph (a), the slope of the Dx vs. t graph is constant and negative at all times. Thus, at all times, v has the same constant and negative value equal to this slope. Therefore, the v vs. t graph in case (a) is a horizontal line below the t-axis.
Similarly, in case (c), the slope of the Dx vs. t graph is constant and positive. Thus, the v vs. t graph is a horizontal line above the t-axis.
In case (b), the slope of the Dx vs. t graph is varying. At t = 0 it is negative because Dx is decreasing as one goes in the direction of increasing t at this point. Thus, the value of v at t = 0 should be negative. Then, as t increases, v should increase (become less negative) because the slope of the Dx vs. t graph is becoming less negative all the time, until the slope and, therefore, the velocity becomes zero at t = tr. Beyond that point, the slope of the Dx vs. t graph turns positive and continues to increase. Likewise, v becomes positive and continues to increase beyond this point.
The graph above of v vs. t in case (b) shows v to be increasing linearly. That the increase should be linear rather than something else cannot be seen from the qualitative explanation above. For that one would have to actually measure the slope at different points along the graph. However, a linear increase of v with t is certainly a possibility, given the way the Dx vs. t graph looks.
Finally, case (d) is similar to case (b). Here, the slope of the Dx vs. t graph is positive at t = 0 and then decreases as t increases. The corresponding v vs. t graph reflects these facts.