Past questions issued on July 4, 1997, July 11, 1997, July 18, 1997, and July 25, 1997 are listed below.
Physics 211 - This is a review question on the material covered in the last three questions, starting with the June 13, 1997 question. (Signs. Terminology.)
These questions dealt with the concepts of position, displacement, and distance travelled. They also dealt with signs and their dependence on the choice of the direction of an axis.
The following two diagrams show two points and an x-axis. The positions of the two points are measured by their x-coordinates. In both diagrams, the origin x = 0 lies between the two points. The origin is not indicated. The only difference between the two diagrams is that in diagram (a) the x-axis points to the right while in diagram (b) it points to the left.


Today's question refers to a motion from point P2 to point P1. Which of the following quantities are positive, which ones are negative: the position coordinates of the two points, the displacement, and the distance travelled? Indicate your answers in the chart below by either a plus or a minus sign. The two rows refer to the choices of axes illustrated in diagrams (a) and (b). The symbol s heading the last column denotes the distance travelled. Two entries in the table have already been made as examples.

Question
Physics 211 - This is one more question on the material covered in the last four questions, starting with the June 13, 1997 question. This question is a variation of the June 27, 1997 question. It deals with graphs of displacement vs. time rather than distance travelled vs. time. (Graphs.)

Suppose a hiker leaves her camp at time t = 0 in the morning and returns to her camp two hours later. Various hypothetical graphs of her displacement from the camp, Dx, vs. time elapsed, t, for the hike are shown above.
Which graph (or graphs) could represent the displacement of the hiker vs. time elapsed? Give reasons, both for the possible and the impossible graphs.
Answer.Physics 211 - The questions this week and the next few weeks will deal with the concepts of velocity and speed and their relationships to position, displacement, and distance travelled. (Graphs.)
Velocity. For an object moving along an x-axis, the object's velocity v at a given instant can be defined as the slope of the object's position vs. time graph at that instant.
To find the slope of a position vs. time graph at a given point, draw the tangent to the graph at that point and take the slope of that tangent. The tangent to a curve at a point is the (unique) straight line that touches the curve at that point, but does not intersect it.
The velocity at a given instant can be either positive or negative or zero, depending on whether the x vs. t graph is rising, horizontal, or falling at that instant.
Speed. The speed of an object at a given instant is equal to the magnitude (absolute value) of the velocity. Thus, if the velocity is 20 m/s, the speed is also 20 m/s. If the velocity is -20 m/s, the speed is still 20 m/s. Thus velocity and speed are not always the same, and one must distinguish between the two concepts.
Question. Draw velocity vs. time graphs for all four displacement vs. time graphs shown below. (These are the same graphs as in the July 11, 1997 question.) You may assume the position x at time t to be zero so that the position x at time t is equal to the displacement Dx at time t as shown in the graphs.
You can draw the v vs. t graphs only qualitatively since no units are indicated on the axes. However, the graphs should be qualitatively correct. For example, if the position vs. time graph has a slope that is decreasing (as t is increasing), the corresponding v-values on the v vs. t graph should be decreasing as well.
Discuss what kind of a motion a hiker would have to perform if she walked as graph (d) suggests. Is this a realistic motion for a hiker?

Physics 211 - The July 18, 1997 question asked you to consider the following four displacement vs. time graphs. (Graphs.)

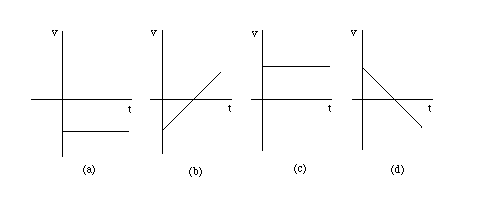
The corresponding velocity vs. time graphs are shown below.

Explain why these velocity vs. time graphs are consistent with the displacement vs. time graphs.
Hint: For a definition of velocity, see the July 18, 1997 question.
Answer.