|
|
|
|
Click on a number to view the explanation of the corresponding item.
There are two basic control buttons:
 Play/Pause. Starts the motion.
After Play has been clicked, the button will change
into the Pause button  .
.
Clicking Pause will freeze the motion. To resume the motion, click Play once more.
 Reset. Resets the applet to its default setting.

The Trace toggle button lets you display/hide the path traveled by the object (car).

The Velocity toggle button lets you display/hide the arrow representing the moving object's velocity vector.

The Image toggle button lets you display/hide the image of the car.


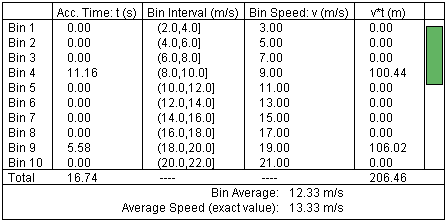
The Data toggle button lets you display/hide the Data box. The box can be dragged to a convenient location by clicking on it and dragging. The green scroll bar on the right lets you scroll through the list of bins.
The Data box contains information in numerical form that the graph of accumulated time vs. speed shown below displays graphically.

The five columns of the Data box contain the following information.
Below the five columns and the Totals of Columns 2 and 5, three additional values are listed:
There are two sliders, shown in the following image. Clicking on a slider to the left or right of the slider tab allows fine adjustment of the slider setting.


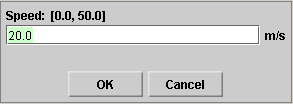
Clicking on the Input Dialog button  of a slider will open a dialog for entering an
exact value for the slider setting. The dialog for the
Speed-slider is illustrated below. The range in which
values can be entered, from 0 m/s to 50.0 m/s in this
case, is indicated above the data entry field.

The two sliders in the control panel allow you to adjust the values of the following quantities.


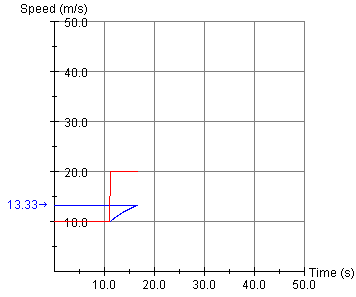
When the Speed vs. Time checkbox is checked, a graph of the moving object's speed vs. time is displayed as in the following image.

The graph displays two curves: instantaneous speed vs. time in red and average speed from the beginning of the motion up to the given instant in blue. In an interval where the latter is equal to the former, the blue graph representing the latter is covered up by the red graph representing the former. In the image above, this is the case in the initial interval from t = 0 to approximately t = 11 s.
The graph also indicates the average speed over the entire time interval by a horizontal blue line and a corresponding value on the vertical axis.
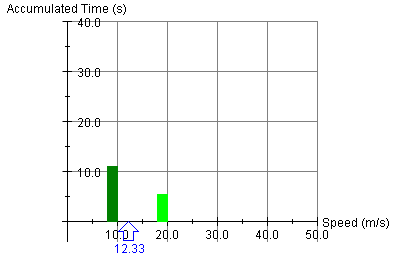
When the Accumulated Time vs. Speed checkbox is checked, the graph of Accumulated Time vs. Speed is displayed as in the following image.

The graph displays the numerical information contained in the Data box in graphical form. See Point 2, "Data Box", for details. It also indicates the Bin Speed Average from the Data Box by means of a blue arrow and a numerical value.
Both graphs can be dragged to a convenient location by clicking in the area of the graph and dragging.

The direction of the motion, whether counter-clockwise or clockwise, can be chosen by clicking one of the two radio buttons.