|
|
|
|
Click on a number to view the explanation of the corresponding item.
There are four basic control buttons. They are, from left to right:
 Rewind. Resets the simulation to the
initial position with the previously chosen initial
values. If you have the particle path displayed, Rewind
will allow you to compare paths traversed under
different conditions, e.g., different initial
velocities.
After clicking Rewind, click Play to restart the motion.
 Play/Pause. Starts the motion.
After Play has been clicked, the button will change
into the Pause button  .
.
Clicking Pause will freeze the motion. To resume the motion, click Play once more.
 Step. Lets you step through the motion in equal
time steps.
 Reset. Resets the applet to its default
setting.
Adjustments in the initial conditions can only be made after first clicking REWIND or RESET.

Displays or hides the satellite's or projectile's path in cyan. The path remains visible at all scale settings (see "7. Scale" below), except when the scale is such that the path is outside of the applet window.
The path is not erased when you click the Rewind button.

Displays an x,y coordinate grid that makes it easier to judge the satellite's or projectile's position. The x-axis points to the right and the y-axis points upward. The origin of the grid is at the very top of the earth's image.
The grid's scale divisions change with the scale setting.

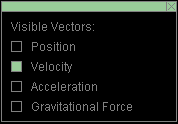
This toggle button displays or hides the Vector Panel shown below on which you can select the vectors that you want to have displayed. Only one vector, the velocity, is selected in the Vector Panel shown below. This corresponds to what is shown in the image at the top of this Help document.
Four vectors can be displayed: Position in cyan, Velocity in magenta, acceleration in orange, and Gravitational Force in green.


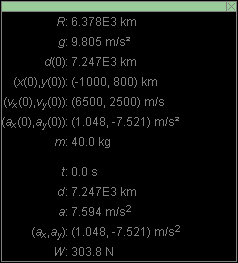
Displays or hides the draggable Data box shown above. The box contains the following information:

When the Coordinates button is selected, clicking anywhere in the applet window will place a "+" marker at the point clicked and display the x,y coordinates of the point. This way you can measure the coordinates of a point. The point can be dragged to a new location as long as the mouse button is depressed. Double-clicking on a "+" will remove it, but only if the Point Coordinates button is selected at the time.

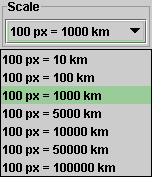
Seven distance scale settings are possible, from 100 pix = 10 km to 100 pix = 100,000 km. A scale setting is selected by pulling down the Scale menu (by clicking on the downward arrow) and selecting the setting from the choices on the menu displayed in the following image.

The length of the magenta arrow representing the velocity varies with different scale settings. Of course, the length of the cyan arrow representing the position vector varies as well with the scale setting. However, the orange arrow representing the acceleration and the green arrow representing the gravitational force acting on the projectile or satellite have the same length at all scale settings.

Four data entry fields are provided for setting the initial velocity, two in the top row for the x and y components of the velocity, and two in the bottom row for the magnitude v and the direction angle θ of the velocity. θ is measured in the positive sense relative to the positive x-axis.
After typing new values into one or two of the fields, hit ENTER to make them effective.
During the motion, these entry fields are constantly being updated and show the current velocity.
When the velocity vector is displayed, the velocity can also be changed by dragging the tip of the velocity vector. However, the Coordinates button should be deselected, because otherwise clicking on the tip of the velocity vector will cause a "+" point marker to be placed there.

Two data entry fields are provided for setting the initial x and y position coordinates of the satellite or projectile.
After typing new values into one or two of the fields, hit ENTER to make them effective.
During the motion, these entry fields are constantly being updated and show the current position.
The position of the projectile or satellite can also be changed by dragging the position or satellite, provided the Coordinates button is not selected. If the Coordinates button is selected, clicking on the projectile or satellite will cause a "+" point marker to be placed there.